Week One: Make Sure the Numbers Can Be Trusted
Before you judge any keyword, confirm that your conversion data is accurate. A campaign can look expensive simply because it is over-counting, or cheap because it is missing half its leads.
Point 1: Check conversion tracking accuracy
Start by testing your key actions. Submit a form, make a test call or complete a purchase, then check that exactly one conversion appears in the account. Look for double counting, where a thank-you page and a form-submit event both fire for the same lead. Also look for false positives, such as a conversion recorded on a page view or a very short visit. The audit guidance we reviewed warns against counting events like a 10-second session as a conversion, and that is a sensible rule.
Point 2: Confirm your primary conversion actions
Google Ads uses primary conversion actions to decide how to bid. Secondary actions are recorded but do not drive bidding. If a low-value action, such as a newsletter sign-up, is marked as primary, the system will optimise towards it and may spend heavily to get more of it. Make sure your primary actions are the outcomes that actually pay the bills, such as a qualified enquiry or a completed order.
Point 3: Check your bidding strategy and budget limits
Automated bidding is useful when it has a clear goal and sensible constraints. An unconstrained “maximise clicks” or “maximise conversions” setting can spend far more than you intended. Check that each strategy has a target cost per acquisition or return on ad spend, and that daily budgets are set at a level you can justify. Confirm, too, whether the account has been receiving auto-applied recommendations that raised budgets or added broad match keywords without anyone noticing.
Week Two: Follow the Search Terms
Keywords tell you what you are bidding on. Search terms tell you what people actually typed. The gap between the two is where most of the waste hides, which is why week two is often the most productive part of the audit.
Point 4: Review the search terms report
Open the search terms report for the last 30 to 90 days and sort it by cost, highest first. Look for queries with meaningful spend and no conversions. Flag any with the wrong intent, such as “free”, “jobs”, “salary”, “DIY”, “how to” or “used”, depending on your business. Look too for competitor names that send people to your site by mistake, and for searches for the wrong product or location. A plumbing firm in Leeds, for example, will not want clicks from people searching for “plumber jobs Manchester”, however cheap they are.
Point 5: Build proper negative keyword lists
Once you have identified irrelevant queries, add them as negative keywords. Build shared negative lists at account level for terms that are wrong everywhere, such as job-seeking or free-only searches, and campaign-level lists for more specific cases. Review the lists weekly for the first month. A negative list is not a one-off task; it is a living record of what your business does not do.
Point 6: Check match types and broad match exposure
Broad match is designed to reach a wide range of related searches, and it can work well with smart bidding and a strong set of negatives. It becomes a leak when it runs on manual bidding without negatives. Measure how much of your spend sits on broad match keywords, and check whether one query is triggering several keywords or campaigns at once. Pause dormant keywords that have had almost no impressions and redundant keywords that compete with each other.
Real-World Benchmarks: What Good Looks Like
It helps to know what “normal” looks like before you decide something is wrong. Benchmarks are a starting point rather than a target, and they vary enormously by industry, offer and location. The most useful UK-relevant source we found is a 2026 report by Visionary Marketing, which pooled data from 240 managed Google Ads accounts across 20 industries between March 2025 and February 2026. Its headline search figures are shown below, with the caveats the authors themselves give.
Metric (search campaigns) | Weighted average | Notes |
|---|
Average cost per click | $4.34 (about £3.42) | Varies widely by sector. See Figure 1. |
Click-through rate | 6.84% | Broad average across the surveyed accounts |
Conversion rate | 5.71% | Lower for some sectors, such as B2B SaaS at 4.21% |
Cost per conversion | $76.12 (about £59.94) | Depends heavily on what counts as a conversion |
Return on ad spend | 4.21x | Survey average, not a target for your account |
Table 2: Headline Google Ads search benchmarks, 2026. Source: Visionary Marketing survey, 240 accounts.
The figures above are useful, but they come with important limits. The data is quoted in US dollars, the authors do not state clearly how the sample is distributed geographically, and they acknowledge that the dataset may over-represent brands that are also active in SEO. Some sector samples are very small, with only five accounts for insurance and eight for legal. Treat the sector chart as a sense check, not a verdict.
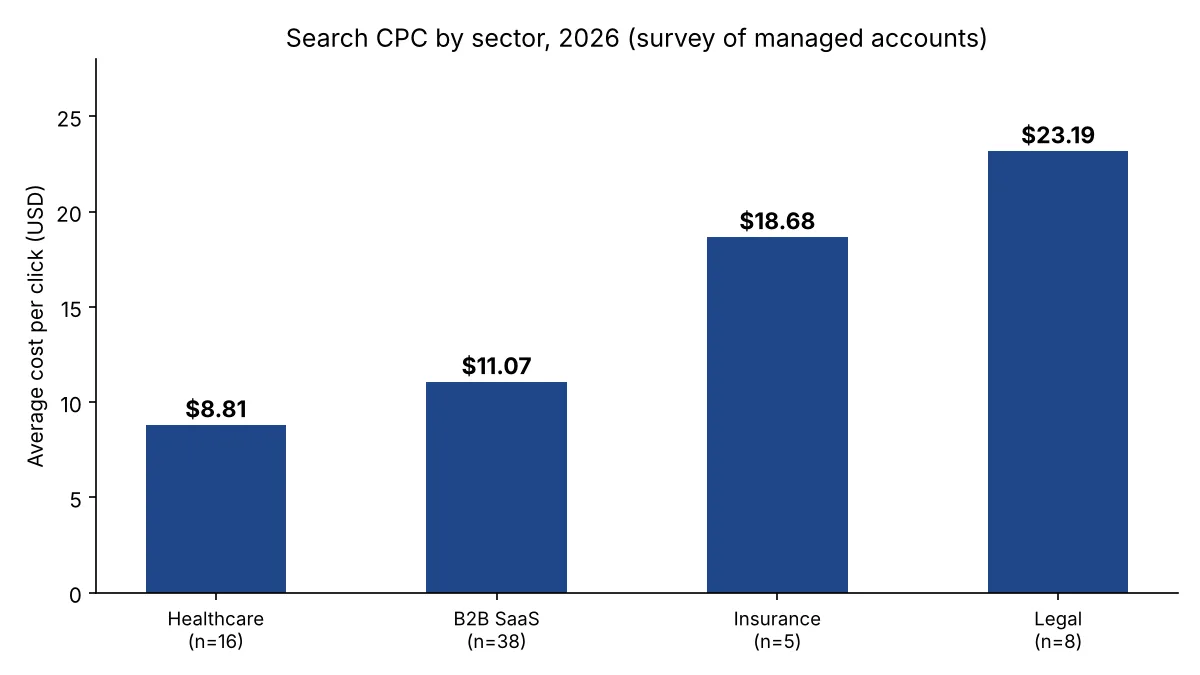
Figure 1: Average search cost per click by sector, 2026. Sample sizes are shown in brackets. Source: Visionary Marketing survey.
Week Three: Check Where and When the Ads Appear
Once the search terms are under control, look at where your ads are showing and when they perform. Default settings and automated features can place your budget in places you never chose.
Point 7: Review network settings
For Search campaigns, check whether Display Network placements are switched on. Search campaigns that also show on the Display Network can spend heavily on low-intent placements that rarely convert. Evaluate Search Partners separately, since their performance can differ from your main Search results. Turn off the options you have not deliberately chosen, and measure the effect over the following two weeks.
Point 8: Analyse device, location and schedule
Compare conversion rates by device, location and time of day. A common pattern is mobile traffic that takes a similar share of the budget to desktop but converts at a fraction of the rate. That might be a landing page problem rather than an audience problem, but either way the budget needs to follow the results. Check that you are not paying for clicks from outside your service area, and that the location setting targets people in your locations rather than people who merely show interest in them. Review whether weekend or overnight activity earns its place.
Point 9: Check automated campaign settings
Performance Max and Display campaigns offer useful reach, but they also come with broad audience and placement settings that can expand well beyond your intent. Check the asset groups, audience signals, exclusions and any optimised targeting options. Look at search term insights for Performance Max where available, and confirm that the campaign is reaching the audiences you want rather than whoever happens to be cheapest to reach.
Week Four: Quality, Landing Pages and the Budget Itself
The final week looks at the quality of what happens after the click, and then at how the budget should be shared out. Two accounts with identical budgets can perform very differently depending on these factors.
Point 10: Review Quality Score and ad relevance
Quality Score combines expected click-through rate, ad relevance and landing page experience. Add these columns to your keyword report and look for patterns. Keywords with below-average landing page experience are a sign you are paying more per click than you need to. Check that each ad group has ads that match its keywords closely, and that headlines reflect what the searcher wanted to find.
Point 11: Test landing pages and the mobile experience
Visit your top three landing pages on a phone, on a slow connection, and with the ads’ promises in mind. Does the page load quickly? Does the headline match the search? Is the call to action obvious, and is the form short enough to finish? A campaign that sends mobile visitors to a slow or confusing page is paying for disappointment. Fix the page before increasing the budget.
Point 12: Reallocate budget and set up reporting
The last point is where the audit pays off. Move budget from the campaigns and keywords that return less towards those that return more, and add reporting that tracks cost per acquisition, conversion rate and return on ad spend by campaign. Set a monthly review rhythm so that the findings do not fade after the audit ends. Good reporting makes the next decision obvious.